Introduction
Union-State financial relations are complex. Though the primary determinant of this relationship is various constitutional provisions, there is substantial non-budgetary flow of resources to the States. There are judicial pronouncements on various issues from time to time, and other institutional arrangements that determine fund flows through the Union Budget and through non-budgetary sources. The complexity of this relationship can be understood when we examine both the qualitative and quantitative dimensions of this relationship. Quantitatively speaking, States spend larger than the Union. As is well known, 60% of the combined government expenditures is at the state level. However, when we take a qualitative view, the influence of the Union on States’ fiscal operations and overall state-level economic management is disproportionately large. Thus, viewing Union-State fiscal relations from the prism of budgetary flows would be partial.
The quantitative dimension, as has evolved, has two components: budgetary transfers and non-budgetary flow of resources. The constitutional provisions, policies and actions of the Union, the power of borrowing by the States as determined by the Union, the operation of the financial sector particularly the public sector banks and other financial institutions, money given as loans to States, money given with conditionality, lending and borrowing by public sector entities, and guarantees given to central public sector undertakings (CPSEs) by the Union government have all explicit and implicit impacts on the financial resource flows to a particular State.
Banking and financial resources flow through the public sector banks have increased significantly over time and have remained unequal across States. More than 80% of the bank credit flows to a few prosperous States in the country. Reddy (2019)[1] observed that “ (T)he dispensation of bank credit remained regressive for various reasons like the concentration of business and industry in the richer States. The average outstanding per capita scheduled bank credit during the years 2013-16 amounted to Rs.94,001 in the top five per capita income States as compared with a meagre Rs.14,475 in the bottom five per capita income States. The flow of bank credit seems to favour richer States relative to others.” Similar trends can also be observed when it comes to the access to external debt by the States. Also, fewer than 10 States contribute to more than 50% of the country’s GDP. The investment inequality and resultant growth and development inequality across States have impacted fiscal capacity and the ability to undertake large public finance led investment by poorer States.
According to Reddy (2019):
- The Constitution provides for one mechanism that addresses fiscal needs of the States, and that is the Finance Commission.
- Fiscal transfers have been occurring outside the recommendations of the Finance Commission and that was for most part on the recommendations of the Planning Commission, and more recently arguably on the advice of NITI Aayog.
- Third, borrowings by States, external or domestic; from market or from Union government are important resources for accelerated development of States.
- Fourth, the financial system, in particular banking, has been an important source of extra budgetary resource for public policy.
- Fifth, the tax concessions, subsidies and other Union government’s programmes do have a differential impact on the States. and are sometimes intended to subserve the policy goal.
The Fiscal Responsibility Legislation with a defined uniform limit of borrowing also limits the capacity of the poorer regions to undertake large public investments. Apart from this, the Union government has both non-financial power and residuary power (as per the Constitution of India) to determine policies that can influence States’ fiscal and macroeconomic management. Union spending, both off budget and through the Union Budget, has asymmetric flows across regions. The interstate infrastructure like railways, national highways, telecommunication are in the domain of the Union government. It is not erroneous to assume that the benefit incidence of such expenditures is also asymmetric across States. There has been a significant increase in growth and inequality in both rural and urban areas and the rural-urban gap has widened in the post-reform period and poorer States gained less than the richer States from economic reforms (Radhakrishna: 2015)[2].
Radhakrishna (2015) further observed that inter-State disparities in per capita income widened in the post-reform period. If per-capita income is considered as a proxy for fiscal capacity of States, increasing per-capita income inequality also implies an increase in fiscal inequality across States. The process of five-year plans and implementation of planning process also brought in an element of centralization. The process of planning and plan coordination were inherently centralized. At the Union level, a rebalancing of these processes requires an institutional arrangement which is flexible, comprehensive, and not driven only by the centrally sponsored and central sector schemes.
Non-budgetary flows are also interlinked with the qualitative dimension of the influence of the Union on the flow of resources to the States and policy actions of the Union government. A few examples in this regard are the functioning of CPSEs, Export Processing Zones and industry-wise tax exemptions. Union government tax expenditures arising due to the tax exemptions have a direct bearing on Union tax revenue and thereby on devolution of taxes to the States. Experience shows that most of the investment and fiscal incentives have disproportionately benefitted the prosperous regions of the country, implying that the cost of this investment has been nationally shared and disproportionately more by the poorer regions (as poorer States receive a larger share of tax devolution)[3]. In the next section, we discuss some of the recent changes in the budgetary transfers after the abolition of the Planning Commission and discontinuation of the plan and non-plan distinction.
Structure of Budgetary Transfers
The major distinction between the pre- and post-Planning Commission structure is that the NITI Aayog is not present in the scheme of resource transfers to the States. After the abolition of the Planning Commission and discontinuation of the Five-Year Plan, the non-Finance Commission grants are called ‘Scheme Based and Other Transfers’ determined by various ministries of the Government of India in the social and economic sectors. Before the abolition of the Planning Commission, the structure of transfers through various Institutions were different and is presented in Figure 1. The structure of transfers after the abolition of the Planning Commission is presented in Figure 2. When it comes to budgetary resource flows, the tax devolution is the primary mode of resource transfers to States (Table 1). As per the recommendations of the Fifteenth Finance Commission, it is 41 per cent of the divisible pool of taxes. The tax devolution is more than 80 per cent of the total transfers provided by the Finance Commission (See Table 1).
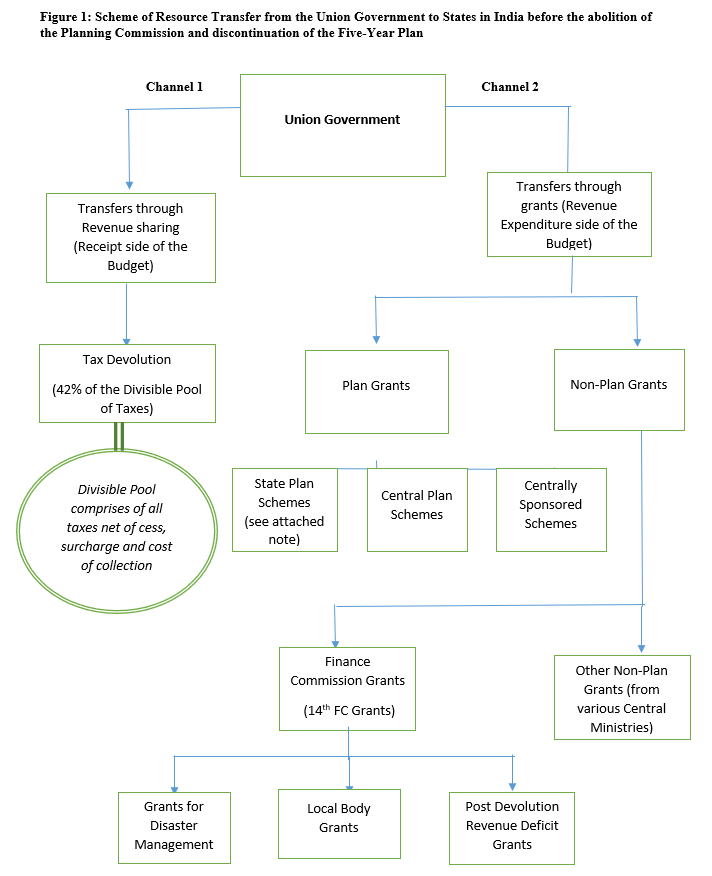

Table 1: Share of Grants and Tax Devolution in Total Finance Commission Transfers (%)
| Commission | Period | Grants-in-aid | Tax devolution | Total Transfers | ||
| (Rs crore) | % share | (Rs. Crore) | % share | (Rs. Crore) | ||
| Sixth | 1974-79 | 2510 | 26.12 | 7099 | 73.88 | 9609 |
| Seventh | 1979-84 | 1610 | 7.72 | 19233 | 92.28 | 20843 |
| Eighth | 1984-89 | 3769 | 9.55 | 35683 | 90.45 | 39452 |
| Ninth * | 1989-95 | 11030 | 9.96 | 99668 | 90.04 | 110698 |
| Tenth | 1995-00 | 20300 | 8.96 | 206343 | 91.04 | 226643 |
| Eleventh | 2000-05 | 58587 | 13.47 | 376318 | 86.53 | 434905 |
| Twelfth | 2005-10 | 142640 | 18.87 | 613112 | 81.13 | 755752 |
| Thirteenth | 2010-15 | 258581 | 15.15 | 1448096 | 84.85 | 1706677 |
| Fourteenth | 2015-20 | 537353 | 11.97 | 3948188 | 88.03 | 4485541 |
| Fifteenth (I) | 2020-21 | 201023 | 19.04 | 855176 | 80.96 | 1056199 |
| Fifteenth(II) | 2021-26 | 1033062 | 19.65 | 4224760 | 80.35 | 5257822 |
Source: 15th FC Report
Non-sharable Pool and Financing of CSS
A large part of scheme-based transfers are also financed by imposing various cesses and surcharges by the Union Government, which are not shareable with the States. What is the shareable and non-sharable pool of taxes? The sharable or divisible pool of taxes is defined as all the taxes collected by the Union government excluding cess, surcharge, and cost of collection. Over the years, the share of cess and surcharges in gross tax revenue of the Union has increased and in turn the share of the divisible pool in total tax revenue has declined. Use of cess and surcharges to finance centrally sponsored and central sector schemes and their impact on States’ fiscal space is a major issue in Union-State fiscal relations in India. Large volumes of resources tied to centrally sponsored schemes are operating in a functional domain that constitutionally belongs to the States. Co-financing of these schemes by States also tie up the States’ resources in central schemes. This reduces State-level fiscal autonomy. Proliferation of centrally sponsored schemes also reduced the Union’s spending on the Union List, with a corresponding increase in Union spending in State List and Concurrent List subjects and a large increase in revenue deficit of the Union government. The Fourteenth Finance Commission analysis of past expenditure pattern of the Union government showed that
between 2002-05 and 2005-11, revenue expenditure by the Union Government on State List subjects increased from an average of 14 percent to 20 percent and on Concurrent List subjects from an average of 13 percent to 17 percent. This implies a reduction in expenditure in percentage terms on Union List subjects. Expenditure functions under the Union List fall predominantly under General and Economic Services. The share of expenditure on these has progressively declined from 66.3 percent in 2001-02 to 53.2 percent in 2014-14(BE).
Non-Divisible Revenue and Fiscal Space
Non-tax revenues sources of the Union government have also increased over the years. One such source is revenue allocation from auction of spectrum. Dividends and profits of Reserve Bank of India constitute a significant part of the total revenue of the Union government. In recent years, these resources have given disproportionately larger fiscal space to the Union to intervene in State subjects in the revenue account, which resulted in an increase in the revenue deficit of both the Union and the States. Reducing the share of CSS, introducing a comprehensive and flexible fiscal equalization programme outside the Finance Commission transfer, and initiating a large public investment programme through higher capital investment can help in bringing equity and symmetry in development across regions.
Equalization Role of Finance Commission and Other Transfers
Indicators used for tax devolution by various Finance Commissions are presented in Table 2. They show that equity dominates the distribution. The second most important factor is the need and cost disability followed by fiscal performance. Various studies have shown that given higher weightage to equity, Finance Commission transfers are the most progressive forms of transfers where poorer States (on per-capita income basis) receives higher transfers compared to middle and high-income States. The degree of progressivity is highest in the case of Finance Commission transfers.
Table 2: Criteria for inter-se Distribution: Eleventh to Fifteenth FCs (%)
| XI FC (2000-05) | XII FC (2005-10) | XIII FC (2010-15) | XIV FC (2015-20) | XV FC – 1st Report (2020-21) | XV FC – Final Report (2021-26) | ||
| Need and Cost Disability | Population (1971) | 10.0 | 25.0 | 25.0 | 17.5 | – | – |
| Population (2011) | – | – | – | 10.0 | 15.0 | 15.0 | |
| Area Adjusted | 7.5 | 10.0 | 10.0 | 15.0 | 15.0 | 15.0 | |
| Forest Cover | – | – | – | 7.5 | 10.0 | 10.0 | |
| Equity | Income Distance | 62.5 | 50.0 | – | 50.0 | 45.0 | 45.0 |
| Fiscal Capacity Distance | – | – | 47.5 | – | – | – | |
| Infrastructure Distance | 7.5 | ||||||
| Performance | Tax Effort | 5.0 | 7.5 | – | – | 2.5 | 2.5 |
| Fiscal Discipline | 7.5 | 7.5 | 17.5 | – | – | – | |
| Demographic Performance | – | – | – | – | 12.5 | 12.5 | |
Multiple channels and designs of transfers from the higher level of government to the sub-national units are common in a multi-level fiscal system. However, achieving an appropriate balance between un-conditional and conditional transfers is a continuous process and depends on the context, purpose and assignment of revenue and expenditure. In India, the Finance Commission devolution has been the main source of unconditional budgetary transfers (through sharing of taxes) that attempts to provide fiscal autonomy and stability of finance to the States. While the Finance Commission transfers are meant to address the current expenditure needs of States, State-specific capital expenditure requirement is determined by the borrowing limit specified by the State-level FRBM Act and the level of revenue deficits/surplus of a State. In addition, no loans can be taken without the prior permission of the Union Government implying that there is no mechanism available to finance capital expenditure need differentials across States without the support of the Union government. In this context, the provision of interest-free loans for capital expenditure to the States by the Union government started since 2020-21 is innovative. However, the implications of financing capital expenditures of States, through interest-free loans as long as the Union has to borrow to finance current expenditures cannot be ignored.
Finally, the flow of resources outside the Finance Commission is significant and to a large extent has diluted the equity outcomes that is necessary of transfers through the Finance Commission. Though there are issues beyond the flow of resources, including the quality of governance across States, aggregate revenue and capital expenditure need assessments, their appropriate financing, supported by a compatible incentive framework would help promote fiscal equalization and balanced regional development.
[1] Reddy, Y. V. (2019): “Inter-State Inequalities-Scope and Limits of Public Policy”, Keynote Address: International Seminar in Honour of Professor R. Radahakrishna
[2] Radhakrishna, R (2015): “Well-being, Inequality, Poverty and Pathways Out of Poverty in India”, Economic and Political Weekly, Vol. 50, Issue No. 41, 10 Oct, 2015
[3] Cost here is an implicit reduction in taxes due the proliferation of incentives. This is affecting poorer states more as their share in tax devolution is higher than the high and middle income states. This is the direct cost poorer regions bear due to the incentives. There are indirect costs also in terms of rising inequality of income, divergence of growth, increasing regional inequality etc.