Pinaki Chakraborty
Kausik K Bhadra
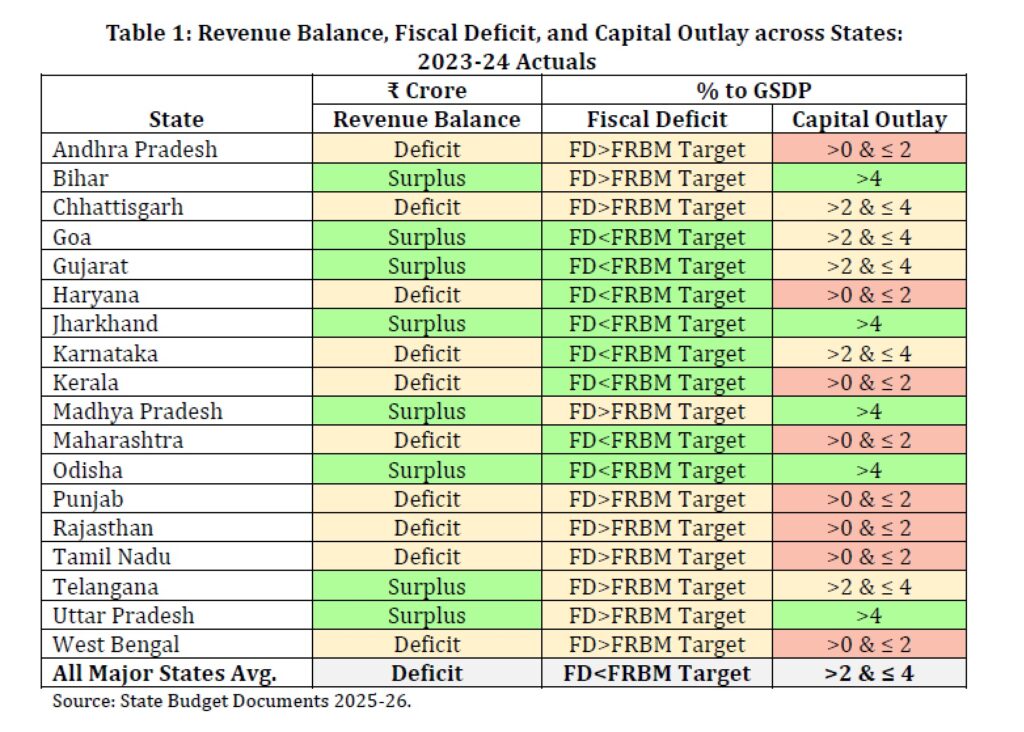
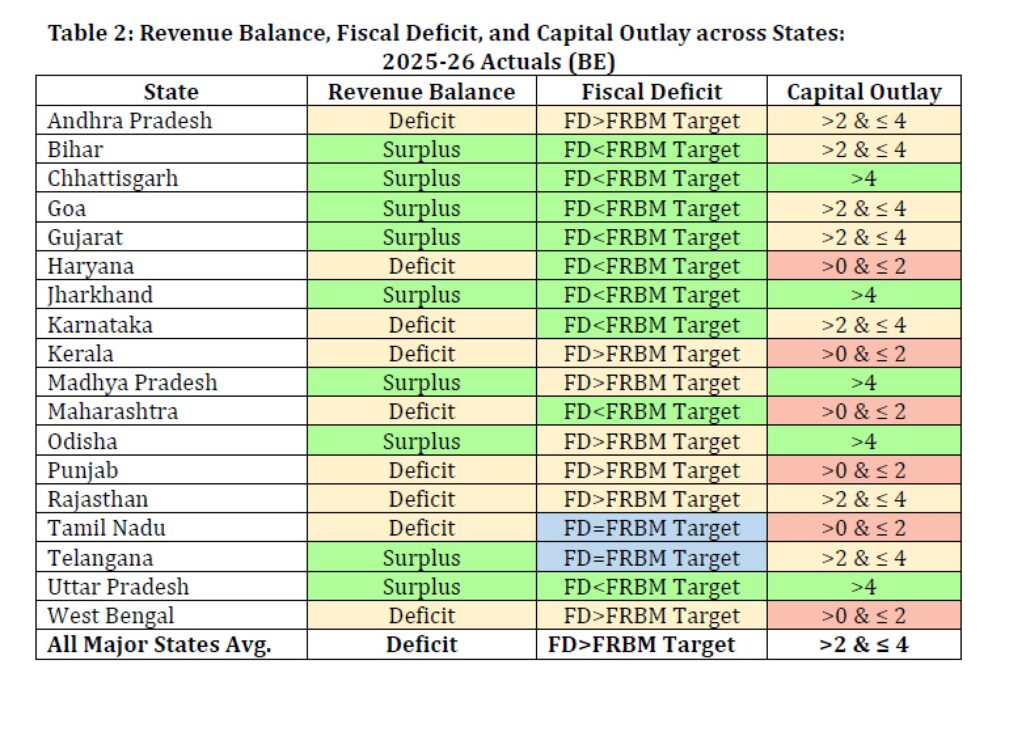
The summary statements of fiscal balance emerging from 2025-26 State Budgets of 18 major States are presented in Tables 1 and 2. These summary statements are based on three indicators, namely, revenue balance, fiscal deficit (against the FRBM target), and capital outlay. The state-wise fiscal profiles are presented in Tables 3 to 21. The key highlights of the fiscal trends emerging from the 2025-26 State Budgets of 18 major states are presented below:
I. As per the 2023-24 Accounts data, out of 18 major states, 10 states had a deficit in their revenue account (Table 1). As per the 2025-26 (BE), the number of states reporting revenue deficits is 9.
II. In the year 2023-24, the states with greater capital outlay (>4% of GSDP) had also generated revenue surpluses except for Telangana.
III. The majority of the revenue surplus-generating states had managed to bring down their fiscal deficits (relative to GSDP) below the FRBM target.
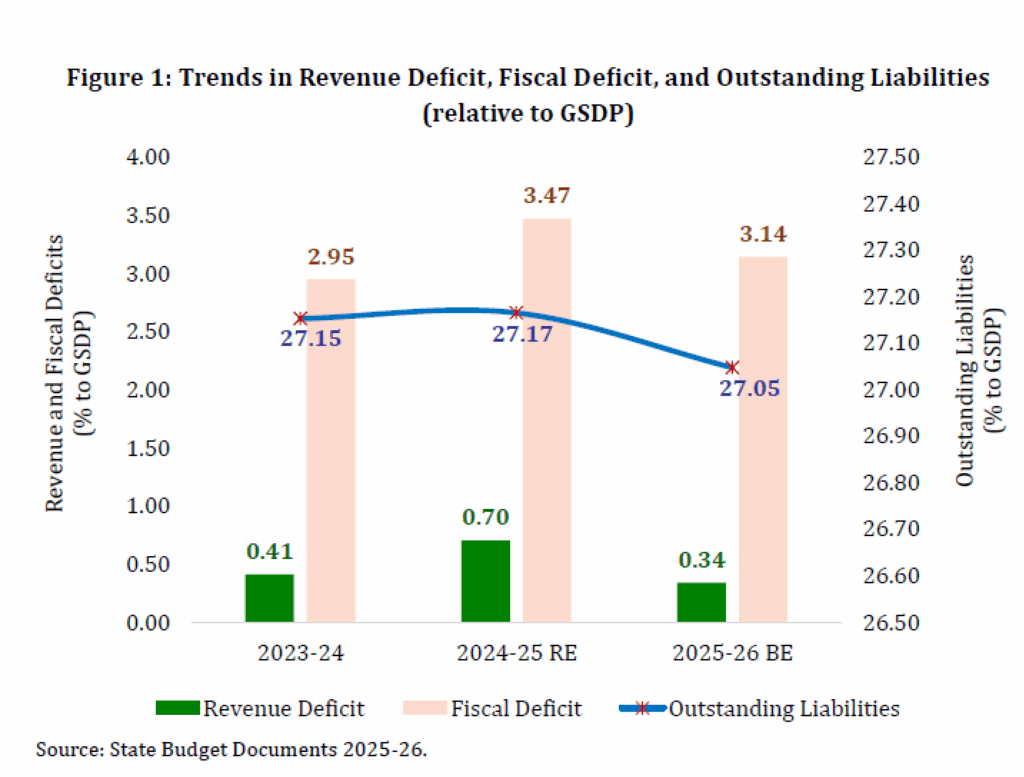
IV. States’ debt in aggregate has not increased between 2023-24 and 2025-26 (BE). The aggregate outstanding debt for all the major states as a percentage of GSDP is expected to show a marginal decline from 27.15% in 2023-24 to 27.05% in 2025-26 (See Figure 1).
V. For the year 2025-26 (BE), the fiscal deficit is expected to be 3.14% of GSDP, which is well below the target proposed by the Fifteenth Finance Commission for the same year.
VI. The share of State Goods and Service Tax (SGST) in total own tax revenue is expected to increase from 42.20% in 2023-24 to 43.57% in 2025-26 (BE).
VII. The all-state own tax revenues to GSDP ratio is expected to increase from 6.57% of GSDP in 2023-24 to 6.91 % of GSDP in 2025-26 (BE).
3: Andhra Pradesh
|
₹ Crore |
|||
|
Heads |
2023-24 |
2024-25 RE |
2025-26 BE |
|
Own Tax Revenue |
85922.4 |
94966.5 |
109006.8 |
|
SGST |
31130.2 |
36295.5 |
40718.1 |
|
Own Non-Tax Revenue |
7432.1 |
7018.1 |
19119.0 |
|
Tax Devolution |
45710.7 |
52080.2 |
57566.3 |
|
Grants-in-Aid |
34701.8 |
21966.4 |
32284.4 |
|
Total Revenue Receipts |
173767.0 |
176031.2 |
217976.5 |
|
Interest Payments |
29481.2 |
30944.4 |
34998.1 |
|
Revenue Expenditure |
212449.6 |
224342.6 |
251162.5 |
|
Capital Outlay |
23330.5 |
24072.5 |
40635.7 |
|
Revenue Deficit |
38682.6 |
48311.5 |
33186.0 |
|
Fiscal Deficit |
62719.6 |
73362.4 |
79926.9 |
|
Primary Deficit |
33238.4 |
42418.0 |
44928.8 |
|
Outstanding Liabilities |
513375.9 |
574987.0 |
647875.0 |
|
GSDP |
1422094 |
1606109 |
1825000 |
|
% of GSDP |
|||
|
Heads |
2023-24 |
2024-25 RE |
2025-26 BE |
|
Own Tax Revenue |
6.04 |
5.91 |
5.97 |
|
Of which, SGST (% of Own Tax Revenue) |
36.23 |
38.22 |
37.35 |
|
Own Non-Tax Revenue |
0.52 |
0.44 |
1.05 |
|
Tax Devolution |
3.21 |
3.24 |
3.15 |
|
Grants-in-Aid |
2.44 |
1.37 |
1.77 |
|
Total Revenue Receipts |
12.22 |
10.96 |
11.94 |
|
Interest Payments |
2.07 |
1.93 |
1.92 |
|
Revenue Expenditure |
14.94 |
13.97 |
13.76 |
|
Capital Outlay |
1.64 |
1.50 |
2.23 |
|
Revenue Deficit |
2.72 |
3.01 |
1.82 |
|
Fiscal Deficit |
4.41 |
4.57 |
4.38 |
|
Primary Deficit |
2.34 |
2.64 |
2.46 |
|
Outstanding Liabilities |
36.10 |
35.80 |
35.50 |
Source: Andhra Pradesh Budget Documents 2025-26.
4: Bihar
|
₹ Crore |
|||
|
Heads |
2023-24 |
2024-25 RE |
2025-26 BE |
|
Own Tax Revenue |
48360.7 |
54300.0 |
59520.0 |
|
SGST |
27678.0 |
31565.0 |
34009.0 |
|
Own Non-Tax Revenue |
5257.1 |
7326.0 |
8220.6 |
|
Tax Devolution |
113604.5 |
129435.0 |
138515.9 |
|
Grants-in-Aid |
26125.0 |
53382.0 |
54575.0 |
|
Total Revenue Receipts |
193347.2 |
244443.0 |
260831.4 |
|
Interest Payments |
17605.8 |
20526.0 |
23013.9 |
|
Revenue Expenditure |
190514.2 |
281230.0 |
252000.3 |
|
Capital Outlay |
36453.0 |
43686.0 |
40532.0 |
|
Revenue Deficit |
-2833.1 |
36787.0 |
-8831.2 |
|
Fiscal Deficit |
35659.9 |
82478.0 |
32718.3 |
|
Primary Deficit |
18054.1 |
61952.0 |
9704.4 |
|
Outstanding Liabilities |
280083.9 |
332575.2 |
353819.1 |
|
GSDP |
854429 |
896429 |
1097264 |
|
% of GSDP |
|||
|
Heads |
2023-24 |
2024-25 RE |
2025-26 BE |
|
Own Tax Revenue |
5.66 |
6.06 |
5.42 |
|
Of which, SGST (% of Own Tax Revenue) |
57.23 |
58.13 |
57.14 |
|
Own Non-Tax Revenue |
0.62 |
0.82 |
0.75 |
|
Tax Devolution |
13.30 |
14.44 |
12.62 |
|
Grants-in-Aid |
3.06 |
5.95 |
4.97 |
|
Total Revenue Receipts |
22.63 |
27.27 |
23.77 |
|
Interest Payments |
2.06 |
2.29 |
2.10 |
|
Revenue Expenditure |
22.30 |
31.37 |
22.97 |
|
Capital Outlay |
4.27 |
4.87 |
3.69 |
|
Revenue Deficit |
-0.33 |
4.10 |
-0.80 |
|
Fiscal Deficit |
4.17 |
9.20 |
2.98 |
|
Primary Deficit |
2.11 |
6.91 |
0.88 |
|
Outstanding Liabilities |
32.78 |
37.10 |
32.25 |
Source: Bihar Budget Documents 2025-26.
5: Chhattisgarh
|
₹ Crore |
|||
|
Heads |
2023-24 |
2024-25 RE |
2025-26 BE |
|
Own Tax Revenue |
38786.2 |
46200.0 |
54000.0 |
|
SGST |
13793.3 |
16919.4 |
18611.4 |
|
Own Non-Tax Revenue |
15148.0 |
17500.0 |
22000.0 |
|
Tax Devolution |
38481.9 |
44000.0 |
50000.0 |
|
Grants-in-Aid |
11092.1 |
13500.0 |
15000.0 |
|
Total Revenue Receipts |
103508.2 |
121200.0 |
141000.0 |
|
Interest Payments |
6798.3 |
9015.2 |
9515.1 |
|
Revenue Expenditure |
114741.0 |
128406.0 |
138196.0 |
|
Capital Outlay |
15418.9 |
22994.0 |
26341.0 |
|
Revenue Deficit |
11232.8 |
7206.0 |
-2804.0 |
|
Fiscal Deficit |
26946.5 |
29350.0 |
22900.0 |
|
Primary Deficit |
20148.2 |
20334.8 |
13384.9 |
|
Outstanding Liabilities |
134172.0 |
164344.5 |
188231.4 |
|
GSDP |
512107 |
567880 |
635917 |
|
% of GSDP |
|||
|
Heads |
2023-24 |
2024-25 RE |
2025-26 BE |
|
Own Tax Revenue |
7.57 |
8.14 |
8.49 |
|
Of which, SGST (% of Own Tax Revenue) |
35.56 |
36.62 |
34.47 |
|
Own Non-Tax Revenue |
2.96 |
3.08 |
3.46 |
|
Tax Devolution |
7.51 |
7.75 |
7.86 |
|
Grants-in-Aid |
2.17 |
2.38 |
2.36 |
|
Total Revenue Receipts |
20.21 |
21.34 |
22.17 |
|
Interest Payments |
1.33 |
1.59 |
1.50 |
|
Revenue Expenditure |
22.41 |
22.61 |
21.73 |
|
Capital Outlay |
3.01 |
4.05 |
4.14 |
|
Revenue Deficit |
2.19 |
1.27 |
-0.44 |
|
Fiscal Deficit |
5.26 |
5.81 |
2.90 |
|
Primary Deficit |
3.93 |
3.58 |
2.10 |
|
Outstanding Liabilities |
26.20 |
28.94 |
29.60 |
Source: Chhattisgarh Budget Documents 2025-26.
6: Goa
|
₹ Crore |
|||
|
Heads |
2023-24 |
2024-25 RE |
2025-26 BE |
|
Own Tax Revenue |
8726.0 |
9277.4 |
9743.2 |
|
SGST |
4057.2 |
4335.5 |
4682.3 |
|
Own Non-Tax Revenue |
4233.6 |
5936.3 |
6105.5 |
|
Tax Devolution |
4359.9 |
4967.3 |
5490.6 |
|
Grants-in-Aid |
966.2 |
1100.5 |
1364.0 |
|
Total Revenue Receipts |
18285.7 |
21281.5 |
22703.3 |
|
Interest Payments |
1889.3 |
2050.4 |
2297.6 |
|
Revenue Expenditure |
17085.6 |
20184.4 |
20299.5 |
|
Capital Outlay |
3572.6 |
5418.3 |
5330.0 |
|
Revenue Deficit |
-1200.1 |
-1097.1 |
-2403.7 |
|
Fiscal Deficit |
1941.3 |
3279.9 |
2826.4 |
|
Primary Deficit |
52.0 |
1229.5 |
528.8 |
|
Outstanding Liabilities |
32918.7 |
34087.8 |
36181.1 |
|
GSDP |
106533 |
121309 |
138625 |
|
% of GSDP |
|||
|
Heads |
2023-24 |
2024-25 RE |
2025-26 BE |
|
Own Tax Revenue |
8.19 |
7.65 |
7.03 |
|
Of which, SGST (% of Own Tax Revenue) |
46.50 |
46.73 |
48.06 |
|
Own Non-Tax Revenue |
3.97 |
4.89 |
4.40 |
|
Tax Devolution |
4.09 |
4.09 |
3.96 |
|
Grants-in-Aid |
0.91 |
0.91 |
0.98 |
|
Total Revenue Receipts |
17.16 |
17.54 |
16.38 |
|
Interest Payments |
1.77 |
1.69 |
1.66 |
|
Revenue Expenditure |
16.04 |
16.64 |
14.64 |
|
Capital Outlay |
3.35 |
4.47 |
3.84 |
|
Revenue Deficit |
-1.13 |
-0.90 |
-1.73 |
|
Fiscal Deficit |
1.82 |
2.70 |
2.04 |
|
Primary Deficit |
0.05 |
1.01 |
0.38 |
|
Outstanding Liabilities |
30.90 |
28.10 |
26.10 |
Source: Goa Budget Documents 2025-26.
: Gujarat
|
₹ Crore |
|||
|
Heads |
2023-24 |
2024-25 RE |
2025-26 BE |
|
Own Tax Revenue |
134262.4 |
147697.8 |
158482.0 |
|
SGST |
58009.9 |
74750.1 |
80520.0 |
|
Own Non-Tax Revenue |
23707.8 |
20308.2 |
23659.0 |
|
Tax Devolution |
39235.5 |
44686.0 |
49401.3 |
|
Grants-in-Aid |
25557.0 |
18839.5 |
20010.8 |
|
Total Revenue Receipts |
222762.7 |
231531.5 |
251553.1 |
|
Interest Payments |
27175.6 |
28707.0 |
31200.7 |
|
Revenue Expenditure |
189285.7 |
210181.2 |
231857.9 |
|
Capital Outlay |
58344.9 |
73720.9 |
100291.0 |
|
Revenue Deficit |
-33477.0 |
-21350.2 |
-19695.2 |
|
Fiscal Deficit |
23493.0 |
50570.0 |
58397.0 |
|
Primary Deficit |
-3682.6 |
21863.0 |
27196.3 |
|
Outstanding Liabilities |
352717.0 |
399633.0 |
455537.0 |
|
GSDP |
2425804 |
2672072 |
2982032 |
|
% of GSDP |
|||
|
Heads |
2023-24 |
2024-25 RE |
2025-26 BE |
|
Own Tax Revenue |
5.53 |
5.53 |
5.31 |
|
Of which, SGST (% of Own Tax Revenue) |
43.21 |
50.61 |
50.81 |
|
Own Non-Tax Revenue |
0.98 |
0.76 |
0.79 |
|
Tax Devolution |
1.62 |
1.67 |
1.66 |
|
Grants-in-Aid |
1.05 |
0.71 |
0.67 |
|
Total Revenue Receipts |
9.18 |
8.66 |
8.44 |
|
Interest Payments |
1.12 |
1.07 |
1.05 |
|
Revenue Expenditure |
7.80 |
7.87 |
7.78 |
|
Capital Outlay |
2.41 |
2.76 |
3.36 |
|
Revenue Deficit |
-1.38 |
-0.80 |
-0.66 |
|
Fiscal Deficit |
0.97 |
1.89 |
1.96 |
|
Primary Deficit |
-0.15 |
0.82 |
0.91 |
|
Outstanding Liabilities |
14.54 |
14.96 |
15.28 |
Source: Gujarat Budget Documents 2025-26.
8: Haryana
|
₹ Crore |
|||
|
Heads |
2023-24 |
2024-25 RE |
2025-26 BE |
|
Own Tax Revenue |
72511.1 |
81944.1 |
92143.7 |
|
SGST |
33960.0 |
37500.0 |
42021.0 |
|
Own Non-Tax Revenue |
8103.0 |
8771.6 |
10334.3 |
|
Tax Devolution |
12345.4 |
14065.7 |
15547.3 |
|
Grants-in-Aid |
8355.4 |
7843.1 |
9791.5 |
|
Total Revenue Receipts |
101314.8 |
112624.4 |
127816.8 |
|
Interest Payments |
21605.0 |
24692.6 |
26231.1 |
|
Revenue Expenditure |
113195.7 |
130472.1 |
148416.6 |
|
Capital Outlay |
15920.9 |
12752.5 |
16164.1 |
|
Revenue Deficit |
11880.9 |
17847.7 |
20599.8 |
|
Fiscal Deficit |
31441.0 |
32556.0 |
35994.7 |
|
Primary Deficit |
9836.1 |
7863.4 |
9763.6 |
|
Outstanding Liabilities |
284852.0 |
317257.0 |
352819.0 |
|
GSDP |
1085510 |
1213951 |
1347486 |
|
% of GSDP |
|||
|
Heads |
2023-24 |
2024-25 RE |
2025-26 BE |
|
Own Tax Revenue |
6.68 |
6.75 |
6.84 |
|
Of which, SGST (% of Own Tax Revenue) |
46.83 |
45.76 |
45.60 |
|
Own Non-Tax Revenue |
0.75 |
0.72 |
0.77 |
|
Tax Devolution |
1.14 |
1.16 |
1.15 |
|
Grants-in-Aid |
0.77 |
0.65 |
0.73 |
|
Total Revenue Receipts |
9.33 |
9.28 |
9.49 |
|
Interest Payments |
1.99 |
2.03 |
1.95 |
|
Revenue Expenditure |
10.43 |
10.75 |
11.01 |
|
Capital Outlay |
1.47 |
1.05 |
1.20 |
|
Revenue Deficit |
1.09 |
1.47 |
1.53 |
|
Fiscal Deficit |
2.90 |
2.68 |
2.67 |
|
Primary Deficit |
0.91 |
0.65 |
0.72 |
|
Outstanding Liabilities |
26.24 |
26.13 |
26.18 |
Source: Haryana Budget Documents 2025-26.
9: Jharkhand
|
₹ Crore |
|||
|
Heads |
2023-24 |
2024-25 RE |
2025-26 BE |
|
Own Tax Revenue |
28004.8 |
33828.0 |
35200.0 |
|
SGST |
12348.0 |
15000.0 |
15500.0 |
|
Own Non-Tax Revenue |
13425.1 |
20026.5 |
25856.1 |
|
Tax Devolution |
37352.4 |
42557.3 |
47040.2 |
|
Grants-in-Aid |
9146.3 |
13925.9 |
17057.1 |
|
Total Revenue Receipts |
87928.5 |
110337.8 |
125153.4 |
|
Interest Payments |
6839.0 |
7152.4 |
6354.7 |
|
Revenue Expenditure |
76676.4 |
98474.2 |
110636.7 |
|
Capital Outlay |
20570.0 |
19096.0 |
22621.0 |
|
Revenue Deficit |
-11252.1 |
-11863.5 |
-14516.7 |
|
Fiscal Deficit |
6331.8 |
11482.7 |
11253.4 |
|
Primary Deficit |
-507.2 |
4330.3 |
4898.8 |
|
Outstanding Liabilities |
127699.8 |
139247.8 |
150197.2 |
|
GSDP |
461010 |
506356 |
556286 |
|
% of GSDP |
|||
|
Heads |
2023-24 |
2024-25 RE |
2025-26 BE |
|
Own Tax Revenue |
6.07 |
6.68 |
6.33 |
|
Of which, SGST (% of Own Tax Revenue) |
44.09 |
44.34 |
44.03 |
|
Own Non-Tax Revenue |
2.91 |
3.96 |
4.65 |
|
Tax Devolution |
8.10 |
8.40 |
8.46 |
|
Grants-in-Aid |
1.98 |
2.75 |
3.07 |
|
Total Revenue Receipts |
19.07 |
21.79 |
22.50 |
|
Interest Payments |
1.48 |
1.41 |
1.14 |
|
Revenue Expenditure |
16.63 |
19.45 |
19.89 |
|
Capital Outlay |
4.46 |
3.77 |
4.07 |
|
Revenue Deficit |
-2.44 |
-2.34 |
-2.61 |
|
Fiscal Deficit |
1.37 |
2.27 |
2.02 |
|
Primary Deficit |
-0.11 |
0.86 |
0.88 |
|
Outstanding Liabilities |
27.70 |
27.50 |
27.00 |
Source: Jharkhand Budget Documents 2025-26.
10: Karnataka
|
₹ Crore |
|||
|
Heads |
2023-24 |
2024-25 RE |
2025-26 BE |
|
Own Tax Revenue |
164696.4 |
180368.0 |
208100.0 |
|
SGST |
71041.5 |
80116.0 |
92132.0 |
|
Own Non-Tax Revenue |
13117.4 |
14500.0 |
16500.0 |
|
Tax Devolution |
41192.6 |
46932.7 |
51876.5 |
|
Grants-in-Aid |
14336.4 |
16000.0 |
16000.0 |
|
Total Revenue Receipts |
233342.9 |
257800.7 |
292476.5 |
|
Interest Payments |
30826.3 |
36633.5 |
45600.2 |
|
Revenue Expenditure |
242614.4 |
283927.8 |
311738.7 |
|
Capital Outlay |
52120.1 |
54411.9 |
68172.2 |
|
Revenue Deficit |
9271.6 |
26127.0 |
19262.2 |
|
Fiscal Deficit |
65522.4 |
82940.1 |
90428.2 |
|
Primary Deficit |
34696.1 |
46306.6 |
44828.0 |
|
Outstanding Liabilities |
603105.0 |
685101.0 |
764655.0 |
|
GSDP |
2567340 |
2861929 |
3070103 |
|
% of GSDP |
|||
|
Heads |
2023-24 |
2024-25 RE |
2025-26 BE |
|
Own Tax Revenue |
6.42 |
6.30 |
6.78 |
|
Of which, SGST (% of Own Tax Revenue) |
43.13 |
44.42 |
44.27 |
|
Own Non-Tax Revenue |
0.51 |
0.51 |
0.54 |
|
Tax Devolution |
1.60 |
1.64 |
1.69 |
|
Grants-in-Aid |
0.56 |
0.56 |
0.52 |
|
Total Revenue Receipts |
9.09 |
9.01 |
9.53 |
|
Interest Payments |
1.20 |
1.28 |
1.49 |
|
Revenue Expenditure |
9.45 |
9.92 |
10.15 |
|
Capital Outlay |
2.03 |
1.90 |
2.22 |
|
Revenue Deficit |
0.36 |
0.91 |
0.63 |
|
Fiscal Deficit |
2.55 |
2.90 |
2.95 |
|
Primary Deficit |
1.35 |
1.62 |
1.46 |
|
Outstanding Liabilities |
23.49 |
23.94 |
24.91 |
Source: Karnataka Budget Documents 2025-26.
11: Kerala
|
₹ Crore |
|||
|
Heads |
2023-24 |
2024-25 RE |
2025-26 BE |
|
Own Tax Revenue |
74329.0 |
81627.3 |
91514.8 |
|
SGST |
30563.6 |
33581.6 |
37763.2 |
|
Own Non-Tax Revenue |
16346.0 |
17905.7 |
19145.5 |
|
Tax Devolution |
21742.9 |
25550.0 |
28616.5 |
|
Grants-in-Aid |
12068.3 |
7846.9 |
13074.9 |
|
Total Revenue Receipts |
124486.2 |
132929.8 |
152351.7 |
|
Interest Payments |
26986.2 |
29739.3 |
31823.7 |
|
Revenue Expenditure |
142626.3 |
162125.7 |
179476.2 |
|
Capital Outlay |
13584.5 |
14069.9 |
16938.1 |
|
Revenue Deficit |
18140.2 |
29195.9 |
27124.5 |
|
Fiscal Deficit |
34258.1 |
44747.1 |
45038.5 |
|
Primary Deficit |
7271.8 |
15007.7 |
13214.8 |
|
Outstanding Liabilities |
391934.2 |
436387.1 |
481997.6 |
|
GSDP |
1146109 |
1275412 |
1427145 |
|
% of GSDP |
|||
|
Heads |
2023-24 |
2024-25 RE |
2025-26 BE |
|
Own Tax Revenue |
6.49 |
6.40 |
6.41 |
|
Of which, SGST (% of Own Tax Revenue) |
41.12 |
41.14 |
41.26 |
|
Own Non-Tax Revenue |
1.43 |
1.40 |
1.34 |
|
Tax Devolution |
1.90 |
2.00 |
2.01 |
|
Grants-in-Aid |
1.05 |
0.62 |
0.92 |
|
Total Revenue Receipts |
10.86 |
10.42 |
10.68 |
|
Interest Payments |
2.35 |
2.33 |
2.23 |
|
Revenue Expenditure |
12.44 |
12.71 |
12.58 |
|
Capital Outlay |
1.19 |
1.10 |
1.19 |
|
Revenue Deficit |
1.58 |
2.29 |
1.90 |
|
Fiscal Deficit |
2.99 |
3.51 |
3.16 |
|
Primary Deficit |
0.63 |
1.18 |
0.93 |
|
Outstanding Liabilities |
34.20 |
34.22 |
33.77 |
Source: Kerala Budget Documents 2025-26.
12: Madhya Pradesh
|
₹ Crore |
|||
|
Heads |
2023-24 |
2024-25 RE |
2025-26 BE |
|
Own Tax Revenue |
90723.9 |
96115.8 |
109157.0 |
|
SGST |
37791.0 |
37498.0 |
42140.0 |
|
Own Non-Tax Revenue |
19925.8 |
21895.3 |
21399.1 |
|
Tax Devolution |
88665.3 |
101020.5 |
111661.9 |
|
Grants-in-Aid |
34711.0 |
42977.5 |
48661.0 |
|
Total Revenue Receipts |
234026.1 |
262009.0 |
290879.0 |
|
Interest Payments |
23098.4 |
26877.0 |
28636.3 |
|
Revenue Expenditure |
221538.0 |
260983.0 |
290261.0 |
|
Capital Outlay |
56538.6 |
64929.9 |
82513.4 |
|
Revenue Deficit |
-12488.1 |
-1026.0 |
-618.0 |
|
Fiscal Deficit |
44485.0 |
62434.0 |
78902.0 |
|
Primary Deficit |
21386.6 |
35557.0 |
50265.7 |
|
Outstanding Liabilities |
497614.4 |
422454.0 |
499870.7 |
|
GSDP |
1363327 |
1503395.4 |
1694477 |
|
% of GSDP |
|||
|
Heads |
2023-24 |
2024-25 RE |
2025-26 BE |
|
Own Tax Revenue |
6.65 |
6.39 |
6.44 |
|
Of which, SGST (% of Own Tax Revenue) |
41.66 |
39.01 |
38.60 |
|
Own Non-Tax Revenue |
1.46 |
1.46 |
1.26 |
|
Tax Devolution |
6.50 |
6.72 |
6.59 |
|
Grants-in-Aid |
2.55 |
2.86 |
2.87 |
|
Total Revenue Receipts |
17.17 |
17.43 |
17.17 |
|
Interest Payments |
1.69 |
1.79 |
1.69 |
|
Revenue Expenditure |
16.25 |
17.36 |
17.13 |
|
Capital Outlay |
4.15 |
4.32 |
4.87 |
|
Revenue Deficit |
-0.92 |
-0.07 |
-0.04 |
|
Fiscal Deficit |
3.26 |
4.15 |
4.66 |
|
Primary Deficit |
1.57 |
2.37 |
2.97 |
|
Outstanding Liabilities |
36.50 |
28.10 |
29.50 |
Source: Madhya Pradesh Budget Documents 2025-26.
13: Maharashtra
|
₹ Crore |
|||
|
Heads |
2023-24 |
2024-25 RE |
2025-26 BE |
|
Own Tax Revenue |
302430.7 |
367467.2 |
387673.7 |
|
SGST |
141978.6 |
167905.0 |
176119.0 |
|
Own Non-Tax Revenue |
20857.9 |
30140.3 |
33052.4 |
|
Tax Devolution |
71262.5 |
81163.3 |
89726.3 |
|
Grants-in-Aid |
36045.4 |
57692.4 |
50511.4 |
|
Total Revenue Receipts |
430596.5 |
536463.3 |
560963.8 |
|
Interest Payments |
45651.9 |
54687.4 |
64658.7 |
|
Revenue Expenditure |
444350.5 |
562998.5 |
606854.7 |
|
Capital Outlay |
72573.0 |
95022.0 |
84457.0 |
|
Revenue Deficit |
13754.0 |
26535.3 |
45890.9 |
|
Fiscal Deficit |
90559.4 |
132873.3 |
136234.6 |
|
Primary Deficit |
44907.4 |
78185.9 |
71575.9 |
|
Outstanding Liabilities |
718507.0 |
839275.0 |
932242.0 |
|
GSDP |
4055847 |
4531518 |
4939355 |
|
% of GSDP |
|||
|
Heads |
2023-24 |
2024-25 RE |
2025-26 BE |
|
Own Tax Revenue |
7.46 |
8.11 |
7.85 |
|
Of which, SGST (% of Own Tax Revenue) |
46.95 |
45.69 |
45.43 |
|
Own Non-Tax Revenue |
0.51 |
0.67 |
0.67 |
|
Tax Devolution |
1.76 |
1.79 |
1.82 |
|
Grants-in-Aid |
0.89 |
1.27 |
1.02 |
|
Total Revenue Receipts |
10.62 |
11.84 |
11.36 |
|
Interest Payments |
1.13 |
1.21 |
1.31 |
|
Revenue Expenditure |
10.96 |
12.42 |
12.29 |
|
Capital Outlay |
1.79 |
2.10 |
1.71 |
|
Revenue Deficit |
0.34 |
0.59 |
0.93 |
|
Fiscal Deficit |
2.23 |
2.93 |
2.76 |
|
Primary Deficit |
1.11 |
1.73 |
1.45 |
|
Outstanding Liabilities |
17.72 |
18.52 |
18.87 |
Source: Maharashtra Budget Documents 2025-26.
14: Odisha
|
₹ Crore |
|||
|
Heads |
2023-24 |
2024-25 RE |
2025-26 BE |
|
Own Tax Revenue |
54427.0 |
60000.0 |
66000.0 |
|
SGST |
23895.7 |
26073.5 |
28174.8 |
|
Own Non-Tax Revenue |
53011.0 |
58000.0 |
60000.0 |
|
Tax Devolution |
51143.7 |
58270.0 |
64408.3 |
|
Grants-in-Aid |
21011.5 |
37730.0 |
41591.7 |
|
Total Revenue Receipts |
179593.3 |
214000.0 |
232000.0 |
|
Interest Payments |
5181.1 |
5500.0 |
6500.0 |
|
Revenue Expenditure |
148831.8 |
186065.4 |
200200.0 |
|
Capital Outlay |
43273.4 |
55392.0 |
65012.0 |
|
Revenue Deficit |
-30761.5 |
-27934.6 |
-31800.0 |
|
Fiscal Deficit |
14742.8 |
29403.4 |
34200.0 |
|
Primary Deficit |
9561.6 |
23903.4 |
27700.0 |
|
Outstanding Liabilities |
96617.7 |
111049.4 |
135001.0 |
|
GSDP |
862658 |
949140 |
1063000 |
|
% of GSDP |
|||
|
Heads |
2023-24 |
2024-25 RE |
2025-26 BE |
|
Own Tax Revenue |
6.31 |
6.32 |
6.21 |
|
Of which, SGST (% of Own Tax Revenue) |
43.90 |
43.46 |
42.69 |
|
Own Non-Tax Revenue |
6.15 |
6.11 |
5.64 |
|
Tax Devolution |
5.93 |
6.14 |
6.06 |
|
Grants-in-Aid |
2.44 |
3.98 |
3.91 |
|
Total Revenue Receipts |
20.82 |
22.55 |
21.83 |
|
Interest Payments |
0.60 |
0.58 |
0.61 |
|
Revenue Expenditure |
17.25 |
19.60 |
18.83 |
|
Capital Outlay |
5.02 |
5.84 |
6.12 |
|
Revenue Deficit |
-3.57 |
-2.94 |
-2.99 |
|
Fiscal Deficit |
1.71 |
3.10 |
3.22 |
|
Primary Deficit |
1.11 |
2.52 |
2.61 |
|
Outstanding Liabilities |
11.20 |
11.70 |
12.70 |
Source: Odisha Budget Documents 2025-26.
15: Punjab
|
₹ Crore |
|||
|
Heads |
2023-24 |
2024-25 RE |
2025-26 BE |
|
Own Tax Revenue |
47252.2 |
57919.0 |
63250.0 |
|
SGST |
20925.0 |
25200.0 |
27650.0 |
|
Own Non-Tax Revenue |
7233.6 |
10825.8 |
12210.6 |
|
Tax Devolution |
20409.9 |
23254.0 |
25703.6 |
|
Grants-in-Aid |
14296.4 |
11721.3 |
10576.2 |
|
Total Revenue Receipts |
89192.1 |
103720.2 |
111740.3 |
|
Interest Payments |
22551.9 |
23953.7 |
24995.5 |
|
Revenue Expenditure |
117407.4 |
132405.1 |
135697.6 |
|
Capital Outlay |
4742.8 |
8346.6 |
10301.6 |
|
Revenue Deficit |
28215.3 |
28685.0 |
23957.3 |
|
Fiscal Deficit |
33115.1 |
36749.9 |
34201.1 |
|
Primary Deficit |
10563.2 |
12796.2 |
9205.6 |
|
Outstanding Liabilities |
325693.7 |
362443.6 |
396644.7 |
|
GSDP |
744899 |
809538 |
891301 |
|
% of GSDP |
|||
|
Heads |
2023-24 |
2024-25 RE |
2025-26 BE |
|
Own Tax Revenue |
6.34 |
7.15 |
7.10 |
|
Of which, SGST (% of Own Tax Revenue) |
44.28 |
43.51 |
43.72 |
|
Own Non-Tax Revenue |
0.97 |
1.34 |
1.37 |
|
Tax Devolution |
2.74 |
2.87 |
2.88 |
|
Grants-in-Aid |
1.92 |
1.45 |
1.19 |
|
Total Revenue Receipts |
11.97 |
12.81 |
12.54 |
|
Interest Payments |
3.03 |
2.96 |
2.80 |
|
Revenue Expenditure |
15.76 |
16.36 |
15.22 |
|
Capital Outlay |
0.64 |
1.03 |
1.16 |
|
Revenue Deficit |
3.79 |
3.54 |
2.69 |
|
Fiscal Deficit |
4.45 |
4.54 |
3.84 |
|
Primary Deficit |
1.42 |
1.58 |
1.03 |
|
Outstanding Liabilities |
43.72 |
44.77 |
44.50 |
Source: Punjab Budget Documents 2025-26.
16: Rajasthan
|
₹ Crore |
|||
|
Heads |
2023-24 |
2024-25 RE |
2025-26 BE |
|
Own Tax Revenue |
94085.9 |
120478.2 |
142743.4 |
|
SGST |
38016.0 |
52100.0 |
63600.0 |
|
Own Non-Tax Revenue |
18679.6 |
26917.3 |
26883.3 |
|
Tax Devolution |
68063.2 |
77547.8 |
85716.5 |
|
Grants-in-Aid |
22447.6 |
37675.0 |
39193.3 |
|
Total Revenue Receipts |
203276.3 |
262618.3 |
294536.5 |
|
Interest Payments |
34127.8 |
39118.1 |
40058.2 |
|
Revenue Expenditure |
242230.9 |
294557.4 |
325545.9 |
|
Capital Outlay |
26645.7 |
38288.2 |
53686.2 |
|
Revenue Deficit |
38954.6 |
31939.2 |
31009.4 |
|
Fiscal Deficit |
65579.6 |
70090.8 |
84643.6 |
|
Primary Deficit |
31451.8 |
30972.7 |
44585.4 |
|
Outstanding Liabilities |
572087.8 |
641683.6 |
725985.0 |
|
GSDP |
1521510 |
1704339 |
1989000 |
|
% of GSDP |
|||
|
Heads |
2023-24 |
2024-25 RE |
2025-26 BE |
|
Own Tax Revenue |
6.18 |
7.07 |
7.18 |
|
Of which, SGST (% of Own Tax Revenue) |
40.41 |
43.24 |
44.56 |
|
Own Non-Tax Revenue |
1.23 |
1.58 |
1.35 |
|
Tax Devolution |
4.47 |
4.55 |
4.31 |
|
Grants-in-Aid |
1.48 |
2.21 |
1.97 |
|
Total Revenue Receipts |
13.36 |
15.41 |
14.81 |
|
Interest Payments |
2.24 |
2.30 |
2.01 |
|
Revenue Expenditure |
15.92 |
17.28 |
16.37 |
|
Capital Outlay |
1.75 |
2.25 |
2.70 |
|
Revenue Deficit |
2.56 |
1.87 |
1.56 |
|
Fiscal Deficit |
4.31 |
4.11 |
4.26 |
|
Primary Deficit |
2.07 |
1.82 |
2.24 |
|
Outstanding Liabilities |
37.60 |
37.65 |
36.50 |
Source: Rajasthan Budget Documents 2025-26.
17: Tamil Nadu
|
₹ Crore |
|||
|
Heads |
2023-24 |
2024-25 RE |
2025-26 BE |
|
Own Tax Revenue |
167278.4 |
192752.4 |
220895.0 |
|
SGST |
61960.3 |
76277.1 |
93619.7 |
|
Own Non-Tax Revenue |
25903.8 |
28123.7 |
28818.6 |
|
Tax Devolution |
46072.3 |
52491.9 |
58021.5 |
|
Grants-in-Aid |
25342.2 |
20538.4 |
23834.1 |
|
Total Revenue Receipts |
264596.7 |
293906.4 |
331569.2 |
|
Interest Payments |
54802.8 |
61883.3 |
70754.0 |
|
Revenue Expenditure |
309718.0 |
340374.0 |
373204.0 |
|
Capital Outlay |
40500.2 |
46766.0 |
57231.0 |
|
Revenue Deficit |
45121.3 |
46467.6 |
41634.8 |
|
Fiscal Deficit |
90430.1 |
101697.9 |
106963.2 |
|
Primary Deficit |
35627.3 |
39814.6 |
36209.2 |
|
Outstanding Liabilities |
724754.4 |
823558.3 |
930130.2 |
|
GSDP |
2721571 |
3115998 |
3567818 |
|
% of GSDP |
|||
|
Heads |
2023-24 |
2024-25 RE |
2025-26 BE |
|
Own Tax Revenue |
6.15 |
6.19 |
6.19 |
|
Of which, SGST (% of Own Tax Revenue) |
37.04 |
39.57 |
42.38 |
|
Own Non-Tax Revenue |
0.95 |
0.90 |
0.81 |
|
Tax Devolution |
1.69 |
1.68 |
1.63 |
|
Grants-in-Aid |
0.93 |
0.66 |
0.67 |
|
Total Revenue Receipts |
9.72 |
9.43 |
9.29 |
|
Interest Payments |
2.01 |
1.99 |
1.98 |
|
Revenue Expenditure |
11.38 |
10.92 |
10.46 |
|
Capital Outlay |
1.49 |
1.50 |
1.60 |
|
Revenue Deficit |
1.66 |
1.49 |
1.17 |
|
Fiscal Deficit |
3.32 |
3.26 |
3.00 |
|
Primary Deficit |
1.31 |
1.28 |
1.01 |
|
Outstanding Liabilities |
26.63 |
26.43 |
26.07 |
Source: Tamil Nadu Budget Documents 2025-26.
18: Telangana
|
₹ Crore |
|||
|
Heads |
2023-24 |
2024-25 RE |
2025-26 BE |
|
Own Tax Revenue |
111798.1 |
129406.8 |
145419.6 |
|
SGST |
39295.0 |
45575.0 |
51000.0 |
|
Own Non-Tax Revenue |
23819.5 |
25814.5 |
31618.8 |
|
Tax Devolution |
23742.0 |
27050.3 |
29899.8 |
|
Grants-in-Aid |
9933.7 |
19836.2 |
22782.5 |
|
Total Revenue Receipts |
169293.4 |
202107.7 |
229720.6 |
|
Interest Payments |
24347.2 |
17729.8 |
19369.0 |
|
Revenue Expenditure |
168514.1 |
196219.0 |
226982.3 |
|
Capital Outlay |
43917.6 |
33087.9 |
36504.4 |
|
Revenue Deficit |
-779.3 |
-5888.7 |
-2738.3 |
|
Fiscal Deficit |
49977.1 |
46764.5 |
54009.7 |
|
Primary Deficit |
25629.9 |
29034.7 |
34640.7 |
|
Outstanding Liabilities |
403664.0 |
451203.0 |
504814.0 |
|
GSDP |
1464378 |
1612579 |
1800325 |
|
% of GSDP |
|||
|
Heads |
2023-24 |
2024-25 RE |
2025-26 BE |
|
Own Tax Revenue |
7.63 |
8.02 |
8.08 |
|
Of which, SGST (% of Own Tax Revenue) |
35.15 |
35.22 |
35.07 |
|
Own Non-Tax Revenue |
1.63 |
1.60 |
1.76 |
|
Tax Devolution |
1.62 |
1.68 |
1.66 |
|
Grants-in-Aid |
0.68 |
1.23 |
1.27 |
|
Total Revenue Receipts |
11.56 |
12.53 |
12.76 |
|
Interest Payments |
1.66 |
1.10 |
1.08 |
|
Revenue Expenditure |
11.51 |
12.17 |
12.61 |
|
Capital Outlay |
3.00 |
2.05 |
2.03 |
|
Revenue Deficit |
-0.05 |
-0.37 |
-0.15 |
|
Fiscal Deficit |
3.41 |
2.90 |
3.00 |
|
Primary Deficit |
1.75 |
1.80 |
1.92 |
|
Outstanding Liabilities |
27.57 |
27.98 |
28.04 |
Source: Telangana Budget Documents 2025-26.
19: Uttar Pradesh
|
₹ Crore |
|||
|
Heads |
2023-24 |
2024-25 RE |
2025-26 BE |
|
Own Tax Revenue |
193129.0 |
208955.0 |
295000.0 |
|
SGST |
75147.0 |
83174.7 |
130425.0 |
|
Own Non-Tax Revenue |
14250.0 |
13407.0 |
24604.0 |
|
Tax Devolution |
202620.0 |
230855.0 |
255172.0 |
|
Grants-in-Aid |
55803.0 |
94390.0 |
87915.0 |
|
Total Revenue Receipts |
465802.0 |
547607.0 |
662691.0 |
|
Interest Payments |
47277.3 |
53804.3 |
64096.0 |
|
Revenue Expenditure |
429787.9 |
488598.5 |
583174.6 |
|
Capital Outlay |
110555.4 |
147718.5 |
165242.9 |
|
Revenue Deficit |
-36014.1 |
-59008.6 |
-79516.4 |
|
Fiscal Deficit |
80722.6 |
94804.6 |
91399.8 |
|
Primary Deficit |
33445.3 |
41000.3 |
27303.9 |
|
Outstanding Liabilities |
777097.6 |
847430.3 |
904785.0 |
|
GSDP |
2547861 |
2751397 |
3077500 |
|
% of GSDP |
|||
|
Heads |
2023-24 |
2024-25 RE |
2025-26 BE |
|
Own Tax Revenue |
7.58 |
7.59 |
9.59 |
|
Of which, SGST (% of Own Tax Revenue) |
38.91 |
39.81 |
44.21 |
|
Own Non-Tax Revenue |
0.56 |
0.49 |
0.80 |
|
Tax Devolution |
7.95 |
8.39 |
8.29 |
|
Grants-in-Aid |
2.19 |
3.43 |
2.86 |
|
Total Revenue Receipts |
18.28 |
19.90 |
21.53 |
|
Interest Payments |
1.86 |
1.96 |
2.08 |
|
Revenue Expenditure |
16.87 |
17.76 |
18.95 |
|
Capital Outlay |
4.34 |
5.37 |
5.37 |
|
Revenue Deficit |
-1.41 |
-2.14 |
-2.58 |
|
Fiscal Deficit |
3.17 |
3.45 |
2.97 |
|
Primary Deficit |
1.31 |
1.49 |
0.89 |
|
Outstanding Liabilities |
30.50 |
30.80 |
29.40 |
Source: Uttar Pradesh Budget Documents 2025-26.
20: West Bengal
|
₹ Crore |
|||
|
Heads |
2023-24 |
2024-25 RE |
2025-26 BE |
|
Own Tax Revenue |
89985.5 |
99863.2 |
112543.8 |
|
SGST |
40899.6 |
45872.5 |
49772.0 |
|
Own Non-Tax Revenue |
3238.1 |
3286.4 |
9360.4 |
|
Tax Devolution |
84971.8 |
96010.0 |
106998.6 |
|
Grants-in-Aid |
22072.2 |
28431.2 |
37157.6 |
|
Total Revenue Receipts |
200267.6 |
227590.8 |
266060.4 |
|
Interest Payments |
42621.0 |
46215.0 |
48778.0 |
|
Revenue Expenditure |
225959.5 |
270852.5 |
301375.4 |
|
Capital Outlay |
28963.1 |
29147.3 |
39337.7 |
|
Revenue Deficit |
25691.9 |
43261.7 |
35315.0 |
|
Fiscal Deficit |
53993.1 |
73017.8 |
73178.0 |
|
Primary Deficit |
11372.1 |
26802.8 |
24400.0 |
|
Outstanding Liabilities |
633960.6 |
706531.6 |
771670.4 |
|
GSDP |
1651374 |
1815010 |
2031805 |
|
% of GSDP |
|||
|
Heads |
2023-24 |
2024-25 RE |
2025-26 BE |
|
Own Tax Revenue |
5.45 |
5.50 |
5.54 |
|
Of which, SGST (% of Own Tax Revenue) |
45.45 |
45.94 |
44.22 |
|
Own Non-Tax Revenue |
0.20 |
0.18 |
0.46 |
|
Tax Devolution |
5.15 |
5.29 |
5.27 |
|
Grants-in-Aid |
1.34 |
1.57 |
1.83 |
|
Total Revenue Receipts |
12.13 |
12.54 |
13.09 |
|
Interest Payments |
2.58 |
2.55 |
2.40 |
|
Revenue Expenditure |
13.68 |
14.92 |
14.83 |
|
Capital Outlay |
1.75 |
1.61 |
1.94 |
|
Revenue Deficit |
1.56 |
2.38 |
1.74 |
|
Fiscal Deficit |
3.27 |
4.02 |
3.60 |
|
Primary Deficit |
0.69 |
1.48 |
1.20 |
|
Outstanding Liabilities |
38.39 |
38.93 |
37.98 |
Source: West Bengal Budget Documents 2025-26.
21: All Major States Combined
|
₹ Crore |
|||
|
Heads |
2023-24 |
2024-25 RE |
2025-26 BE |
|
Own Tax Revenue |
1806710 |
2063167 |
2360393 |
|
SGST |
762490 |
889739 |
1028457 |
|
Own Non-Tax Revenue |
293689 |
337703 |
398887 |
|
Tax Devolution |
1010976 |
1151937 |
1271363 |
|
Grants-in-Aid |
384011 |
505396 |
541380 |
|
Total Revenue Receipts |
3495387 |
4058202 |
4572024 |
|
Interest Payments |
468866 |
519229 |
578881 |
|
Revenue Expenditure |
3607527 |
4272397 |
4687080 |
|
Capital Outlay |
667025 |
788920 |
931311 |
|
Revenue Deficit |
112140 |
214195 |
115056 |
|
Fiscal Deficit |
811918 |
1058602 |
1073216 |
|
Primary Deficit |
343052 |
539373 |
494335 |
|
Outstanding Liabilities |
7470856 |
8289249 |
9232455 |
|
GSDP |
27514361 |
30514361 |
34134439 |
|
% of GSDP |
|||
|
Heads |
2023-24 |
2024-25 RE |
2025-26 BE |
|
Own Tax Revenue |
6.57 |
6.76 |
6.91 |
|
Of which, SGST (% of Own Tax Revenue) |
42.20 |
43.12 |
43.57 |
|
Own Non-Tax Revenue |
1.07 |
1.11 |
1.17 |
|
Tax Devolution |
3.67 |
3.78 |
3.72 |
|
Grants-in-Aid |
1.40 |
1.66 |
1.59 |
|
Total Revenue Receipts |
12.70 |
13.30 |
13.39 |
|
Interest Payments |
1.70 |
1.70 |
1.70 |
|
Revenue Expenditure |
13.11 |
14.00 |
13.73 |
|
Capital Outlay |
2.42 |
2.59 |
2.73 |
|
Revenue Deficit |
0.41 |
0.70 |
0.34 |
|
Fiscal Deficit |
2.95 |
3.47 |
3.14 |
|
Primary Deficit |
1.25 |
1.77 |
1.45 |
|
Outstanding Liabilities |
27.15 |
27.17 |
27.05 |
Source: Authors computations based on Tables 3 – 20.